Short term rental investment analysis of Cancún, Tulum, and Playa del Carmen, Mexico. Plus a free financial model.
Table of Contents
Introduction
And if you just want to skip straight to the numbers, you can download the model here
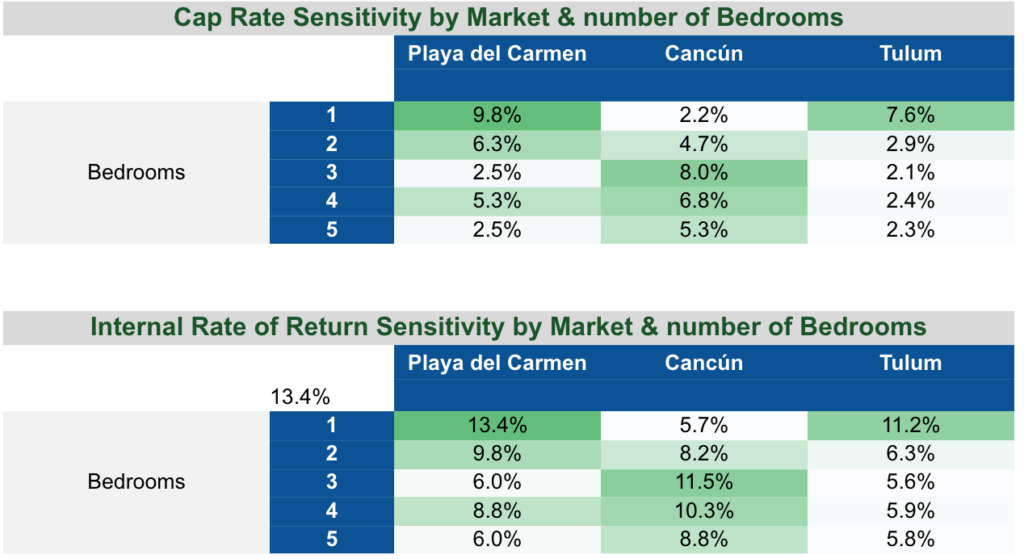
TLDR: Playa del Carmen’s 1-bedrooms offer the highest Cap Rate & IRR in the Riviera Maya, followed by 3-bedrooms in Cancún
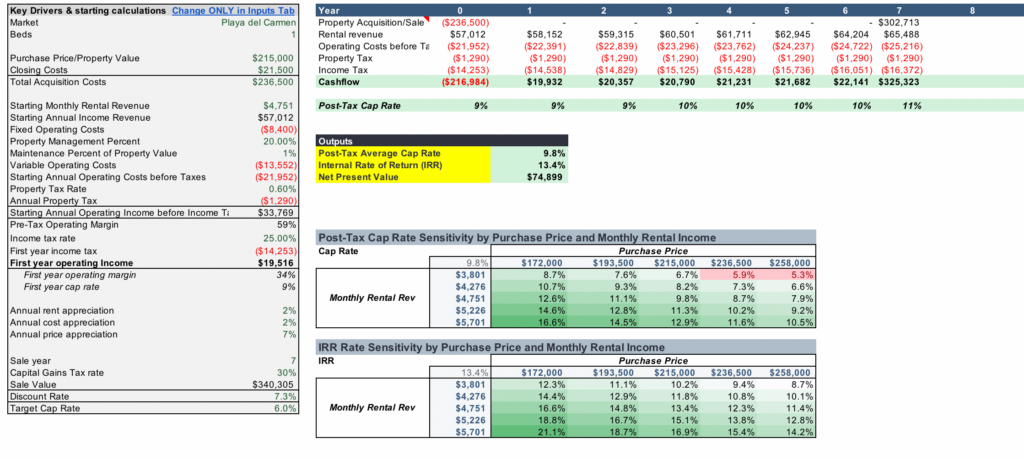
Playa del Carmen 1-bedrooms come in at a median price of $215K. Based on a blend of median and average airbnb rates for 1-bedrooms in Playa del Carmen, we estimate that a typical well-managed 1-bed short-term-rental in Playa del Carmen would generate $57,000 USD in revenue, about $20,000 USD in positive cashflow after expenses and taxes annually.
At the 6.78% 10-year average price appreciation average for residential real estate in Mexico, we’d expect a total net present value (NPV) of $75K on the $215K purchase price the unit is sold after 7 years, yielding a 13% internal rate of return (IRR).
Revenue: expected monthly short-term rental income
Main source: Airbnb listing data, Airbnb occupancy data.
TLDR: The weighted average of estimated monthly rental revenue in Playa del Carmen, Cancún, and Tulum is $4,040 , $5,889 , and $4,533 respectively (USD).
To get estimates for expected nightly rates by number of bedrooms, I used a random sample of the listed prices for 1,000 Airbnb listings in each market. Because there’s seasonality in prices, I didn’t specify any particular days in this search. Instead of just taking the average or the median of the prices, each of which is subject to being skewed depending on the distribution, I took the midpoint of the two.
This is something you could dispute as too aggressive, so I’ve included both data points in the Model; however, my perspective is that, as an investor looking to maximize ROI, it’s fair to assume that we’d skew closer to the average.
A few months back, Airbnb used to share the average occupied nights by market and number of guests. They don’t anymore but, luckily, I stored that data in a spreadsheet for safekeeping. I applied those occupancy rates to the nightly rates computed above:

Estimated monthly rental income by market and number of bedrooms (USD)
Property acquisition costs: home prices and closing costs
Main source: Far Homes proprietary data 😎
Home prices
TLDR: Median home prices in Playa del Carmen, Cancún, and Tulum are $306K, $329K, and $287K USD respectively.
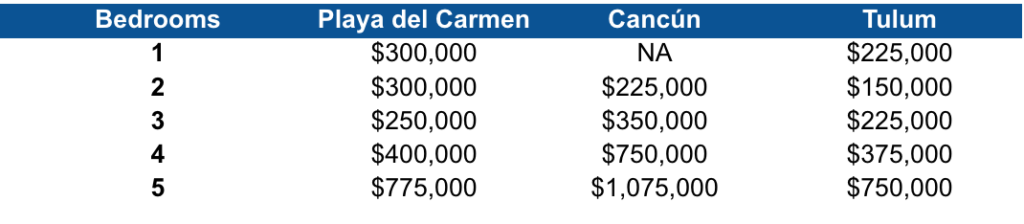
Using active listings on our website, here’s the median list price of residential properties in the three markets we’re analyzing by the number of bedrooms. This includes condos, townhouses, and single-family homes.
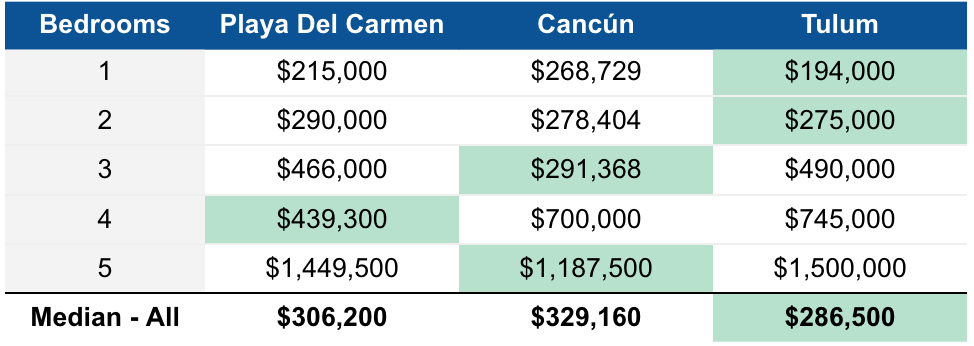
Median home price by market & number of bedrooms (USD)
Tulum’s prices skew low, but not necessarily because it’s consistently cheaper than the other two markets—rather, there’s just a much larger supply of one and two bedrooms. On the same note: distribution of homes for sale by the number of bedrooms is far different in Cancún than Playa del Carmen and Tulum.
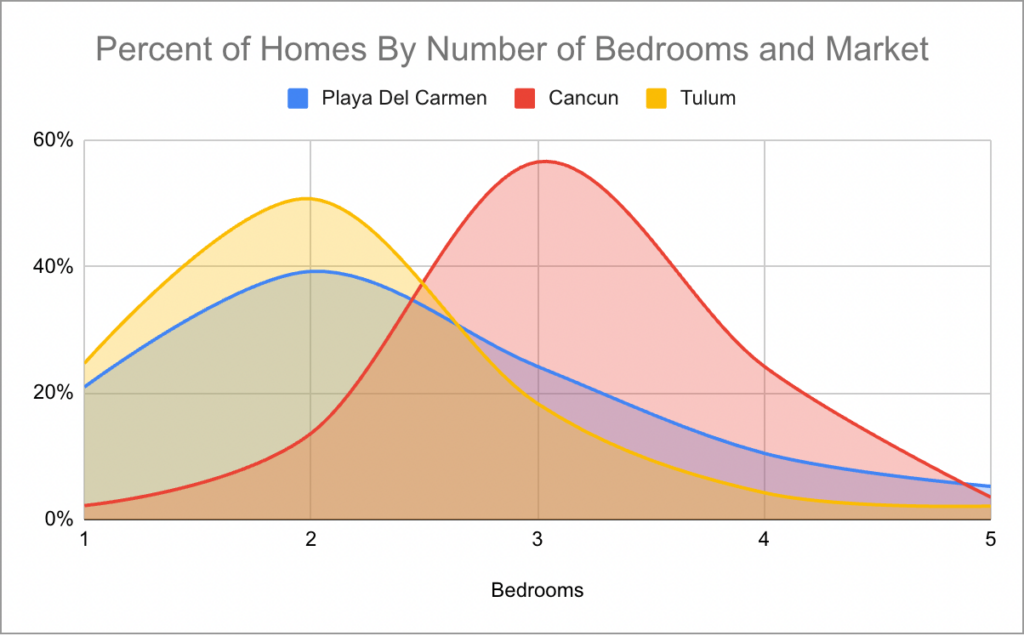
Percent of Homes for Sale by Number of Bedrooms & Market
Given the results we saw in our summary at the top of the article: it makes sense that there’s the greatest supply of 3-beds in Cancún, since those seem to be driving the highest returns on that market.
Closing costs
TLDR: Assume closing costs will be nearly 10% of the property’s purchase price.
Closing costs in Mexico include a variety of fixed-cost charges, as well as taxes or fees that are calculated on a percentage of the purchase price. Generally, they come out to 5% – 10% of the purchase price.
If you’re buying a home worth $400K USD or less, it’s going to be closer to the 10% mark because of the fixed cost components, such as legal fees, trust setup fees, cost for the appraisal, etc.
A detailed breakdown of closing costs is out-of-scope for this writeup, but if you want to learn more we have more information on closing costs here.
Operating expenses and taxes
Main sources: Far Homes data, knowledge gathered from experienced agents and attorneys.
HOA fees, property management, and maintenance
TLDR: HOA fees will probably be about $200 USD/month. Property management will probably be 20%-25% of rental income. Maintenance costs are harder to estimate, but I assume 1% of the property value annually.
We see an average HOA fee of $288 USD and a median of $208 USD across Playa del Carmen, Cancún, and Tulum. However, about 45% of the properties with HOA data have a monthly fee of $150 USD or lower:
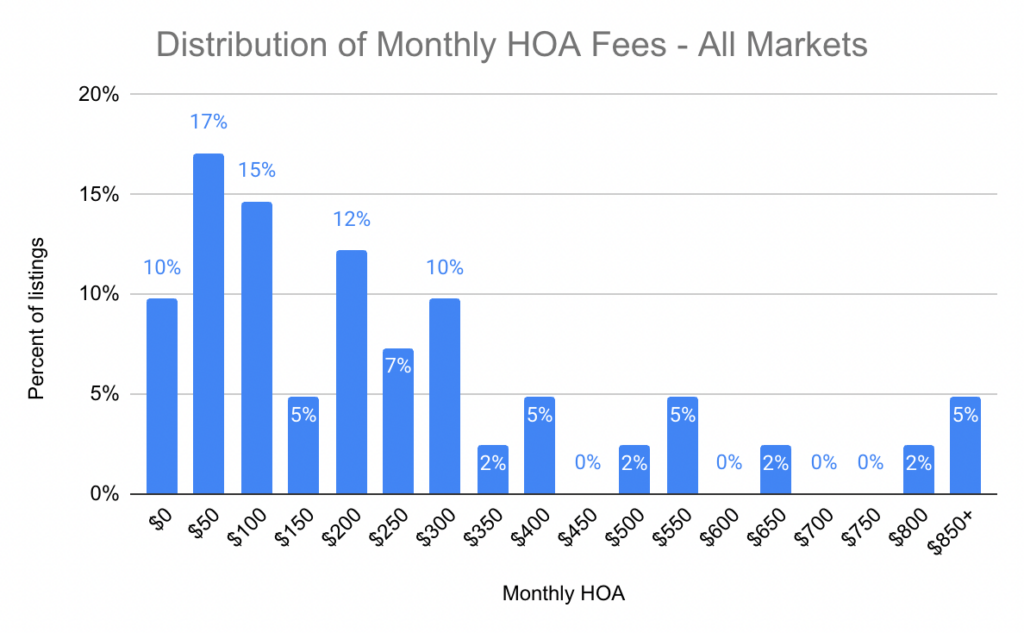
Distribution of Monthly HOA Fee (USD)
Property management fees vary depending on the extent of services rendered. I don’t have enough data to provide a rock-solid estimate, but the property managers we’ve spoken with tend to charge in the 20%-25% range. I’ve put 20% as the default assumption in the model because I’d probably try to get a property management company that only does the maintenance/cleaning/etc., and I’d handle the listing management myself.
Finally, maintenance fees. For the sake of simplicity, I’m following the ol’ “1% rule” here in my assumptions, though perhaps more sophisticated investors will roll their eyes. If I knew I was buying a single-family home, or a unit in an older building, I’d bump this up.
Rental income tax, property tax, & other recurring costs
TLDR: I assume 25% pre-deduction rental income tax and 0.6% property tax. For other recurring costs, I assume $500 USD a month.
NOTE: I’m far from an expert on Mexico’s tax system; please get professional advice on this part especially.
For the sake of my own modeling, I’ve assumed a 25% rental income tax on gross receipts, not profits, based on Mexico’s standard income tax scheme. There are likely ways to lower this tax burden—by qualifying, for example under the new Technology Platforms tax scheme—but I’m erring on the conservative side.
I’m not accounting for Mexico’s 16% Value Added Tax (IVA) here, because that’s typically charged to the person booking your home when they pay to rent the property.
For property tax (impuesto predial), I’m using 0.6% of the property’s purchase price annually as the assumption. The actual rates are tricky to find online; this number comes from an attorney in Quintana Roo with whom we work. In reality, it’s often actually much lower than this.
For other recurring costs, I’m assuming a blanket $500 a month. This should cover things like new supplies, internet, miscellaneous expenses, and the $500/year renewal cost for owning a property via a bank trust (fideicomiso), which is how most foreigners structure their property ownership. If I were planning to buy a single-family home, or a unit in an older building, I’d probably bump this up.
Other key considerations
Financing
Most foreigners buying homes in Mexico don’t qualify for financing. As a result, the model assumes a cash purchase.
If, however, you’re interested in obtaining financing as a foreigner, you can get in touch with us to discuss what options you may have.
Selling your home: capital gains tax
As with the earlier discussions of tax: I’m not an expert, do your own research and/or speak with a professional.
Capital gains tax is typically 35% of net capital gains from the sale of the property. Unlike income tax, however, you can deduct a number of expenses (e.g. brokerage fees, notary fees, certain investment and improvement costs, etc.) from the capital gains tax. In the model, I assume our effective capital gains rate is 30%; given that brokerage fees alone are typically 5%+, it’s a conservative assumption.
Putting it all together
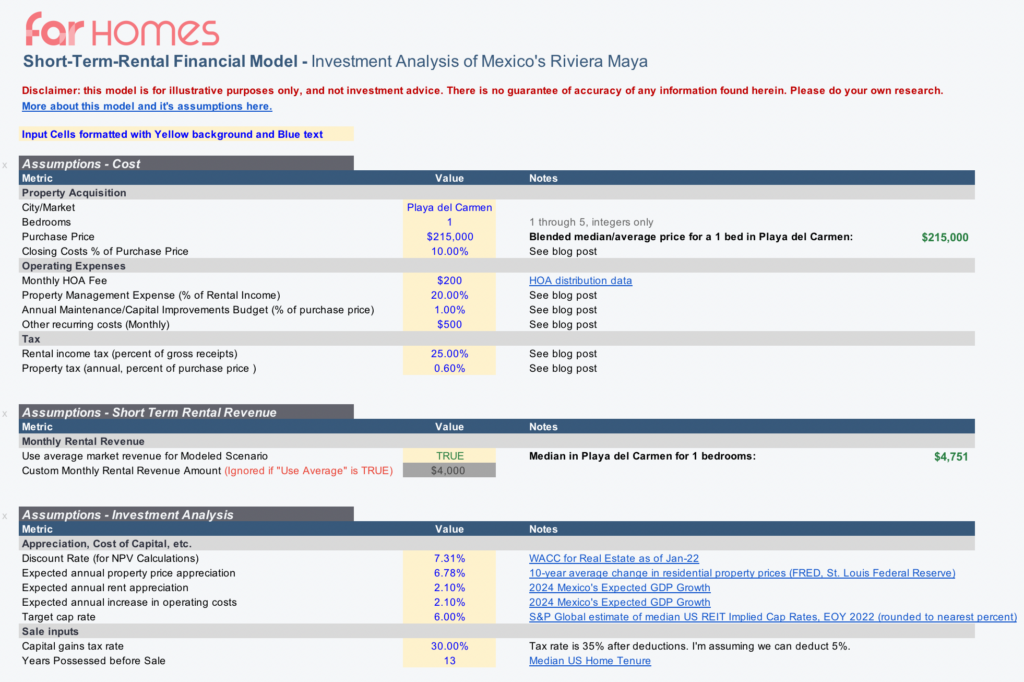
Screenshot of the inputs tab
There are a few main components to the model:
- The “Inputs” tab. All the key assumptions are here. With one or two exceptions, this is the only place that you should edit inputs in the model.
- The “Output – Modeled Scenario” tab. This is the main model; it takes all the inputs directly from the “Inputs” tab and returns what you see in the screenshot above. If you’re considering a specific unit, or have developed your own perspective on what rental income is reasonable for a property you’re evaluating, this is the tab where you’d be able to see the results of that displayed explicitly.
- The “Output – Compare Market ROI Avg” tab. This exists primarily for the analysis above in the article. However, if you’re curious to see how markets’ investment opportunities compare after making changes to the main inputs, you’ll be able to do so here.
- The “Output – Price Breakeven Cap Rt” tab. Similar to the Compare Market ROI tab. The summary is totally static, and probably won’t do you much good. However, the Dynamic sensitivity table below does update automatically; if you change any of the key inputs on the main Inputs tab or the price and monthly rental revenue inputs in F6:H6 and F10:H10 of this tab, you’ll be able to see how your upper limit on price to hit your target cap rate changes.
Some noteworthy insights
Maximum purchase price to hit 6% cap rate
If you keep my assumptions (discussed above), here’s the maximum purchase price you can make for a property to hit a target cap rate of 6% or better for the typical short-term rental property in each market.
Tulum 1-bedrooms offer an 8% cap rate at a lower price tag ($194K median)
The flipside is that there’s a large amount of inbound supply (new developments) poised to go on the market over the next few years. The agents and developers we speak with are confident that the boom in tourist demand will continue to outpace new units coming onto the market that cater to tourists & short-term rentals, but it’s a consideration at least worth noting and coming up with your own perspective on.
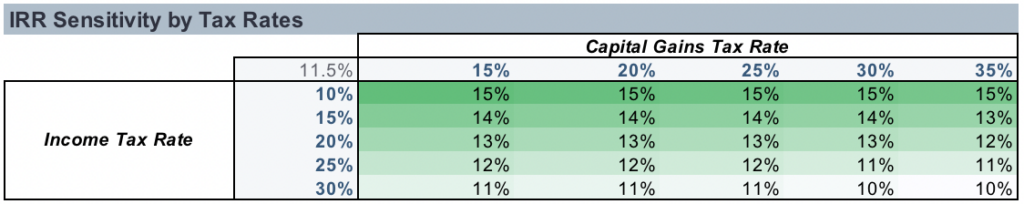
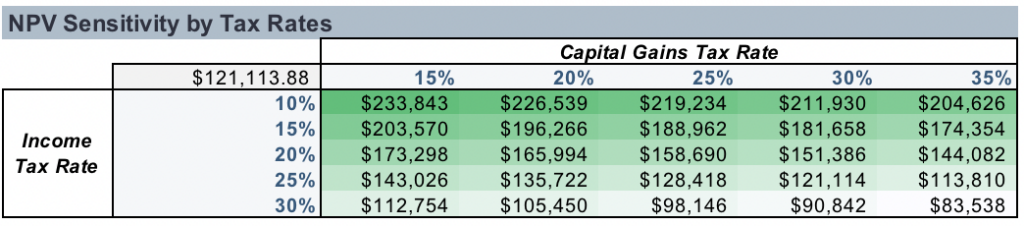
Investors may be able to boost NPV of their investment 25%+ by lowering their tax rate just 5%
Here’s a look at how IRR and NPV change for the typical 3-bedroom Cancún short-term rental by how tax-efficient you are on both income tax and capital gains tax:
Things I didn’t cover
- Sell-side transaction costs. I mostly just didn’t have the time to add this in. However, because I keep the default effective capital gains tax at 30%, it should in theory cover a good chunk of these transaction costs, since you can deduct the transaction costs from capital gains. If you want to be conservative, you can just bump up the capital gains tax input.
- More nuanced analysis of location within each market, and how that impacts price and rental yield.
- Impact of amenities on price and rental income.
- New construction vs existing homes from an investor perspective.
- Modeling exchange-rate risk.
- US/Canadian tax treatment of owning foreign property. This is something I’m just personally not equipped to provide information on, but maybe one day I can share some information from an expert.
- Multi-unit, commercial properties, land, etc.